Performance Testing
QED's performance testing framework leverages Kotlin coroutines for realistic, concurrent load simulation. With built-in telemetry, stress-level control, and markdown-friendly reporting, it enables longitudinal performance tracking with minimal ceremony.
Structure
The core of a performance test is the PerformanceTestContext, an extension of TestContext. A performance test is structured in two parts:
- a coroutine block that executes the test logic, and
- a control block that manages the concurrent execution of those coroutines
private val baseTest = BaseTest()
private val hasRest = HasRest(baseTest, urlKey = "url")

private class APIChallengesPerformanceTest : PerformanceTestContext(baseTest, null,
    hasRest, stressLevel = StressLevel.BASELINE) {

    @Test(priority = 0, description = "Concurrent POST test with jitter", groups = ["All"])
    fun Post1Test() = runConcurrentTest("Post1Test") {
        logger.info { "StressLevel: $stressLevel" }
        logger.info { "START TEST" }

        coroutineScope {
            val jobs = (0..9).map {
                launch(ctx) {
                    delay(Random.nextLong(10, 100)) // jitter makes simulation more realistic
                    doPost(it)
                }
            }
            jobs.joinAll()
        }

        logger.info { "END TEST" }
    }
}
Setup Guide
- Use
PerformanceTestContextinstead ofTestContext. The constructor parameters are the same (e.g.,HasBrowser?,HasRest?). - Annotate the test function with
@Testand wrap it in= runConcurrentTest(name). - Use
coroutineScopefor structured concurrency. - Launch coroutines using
launch(Dispatchers.IO + coroutineContext) { ... }. In the example above this is done viaval jobs = ..., wheredoPostis the coroutine that executes the test logic. - Stress Level Control —
stressLevel = StressLevel.BASELINE(default) gives a realistic load simulation.StressLevel.STRESSfloods the IO pools and produces an unrealistic load. - Call
jobs.joinAll()to wait for all coroutine instances to finish. - It is good practice to log the current stress level at the start of each test run.
Coroutine Setup
suspend fun doPost(index: Int) = withIOContext {
    delay(Random.nextLong(10, 100)) // jitter in ms
    val json = generatePayload(index)
    val result = rest.sendUntyped(RequestType.POST, APIChalURLPath.SIM_ENTITIES, json, 201, trackPerformance = true)

    val logger = currentCoroutineContext()[LoggerContext]?.logger ?: error("LoggerContext missing")
    logger.info { "POST #$index executed in coroutine" }

    verify("check response body for name=bob and id=11") {
        expect(result.get("name")).to.equal("bob")
        expect(result.get("id")).to.equal(11)
    }
}
Key elements:
suspend— marks the function as suspendable, so it can be paused and resumed without blocking the thread= withIOContext { ... }— ensures execution runs on the IO dispatchertrackPerformance = true— everyrest.sendrequest with this flag set will be tracked for performance
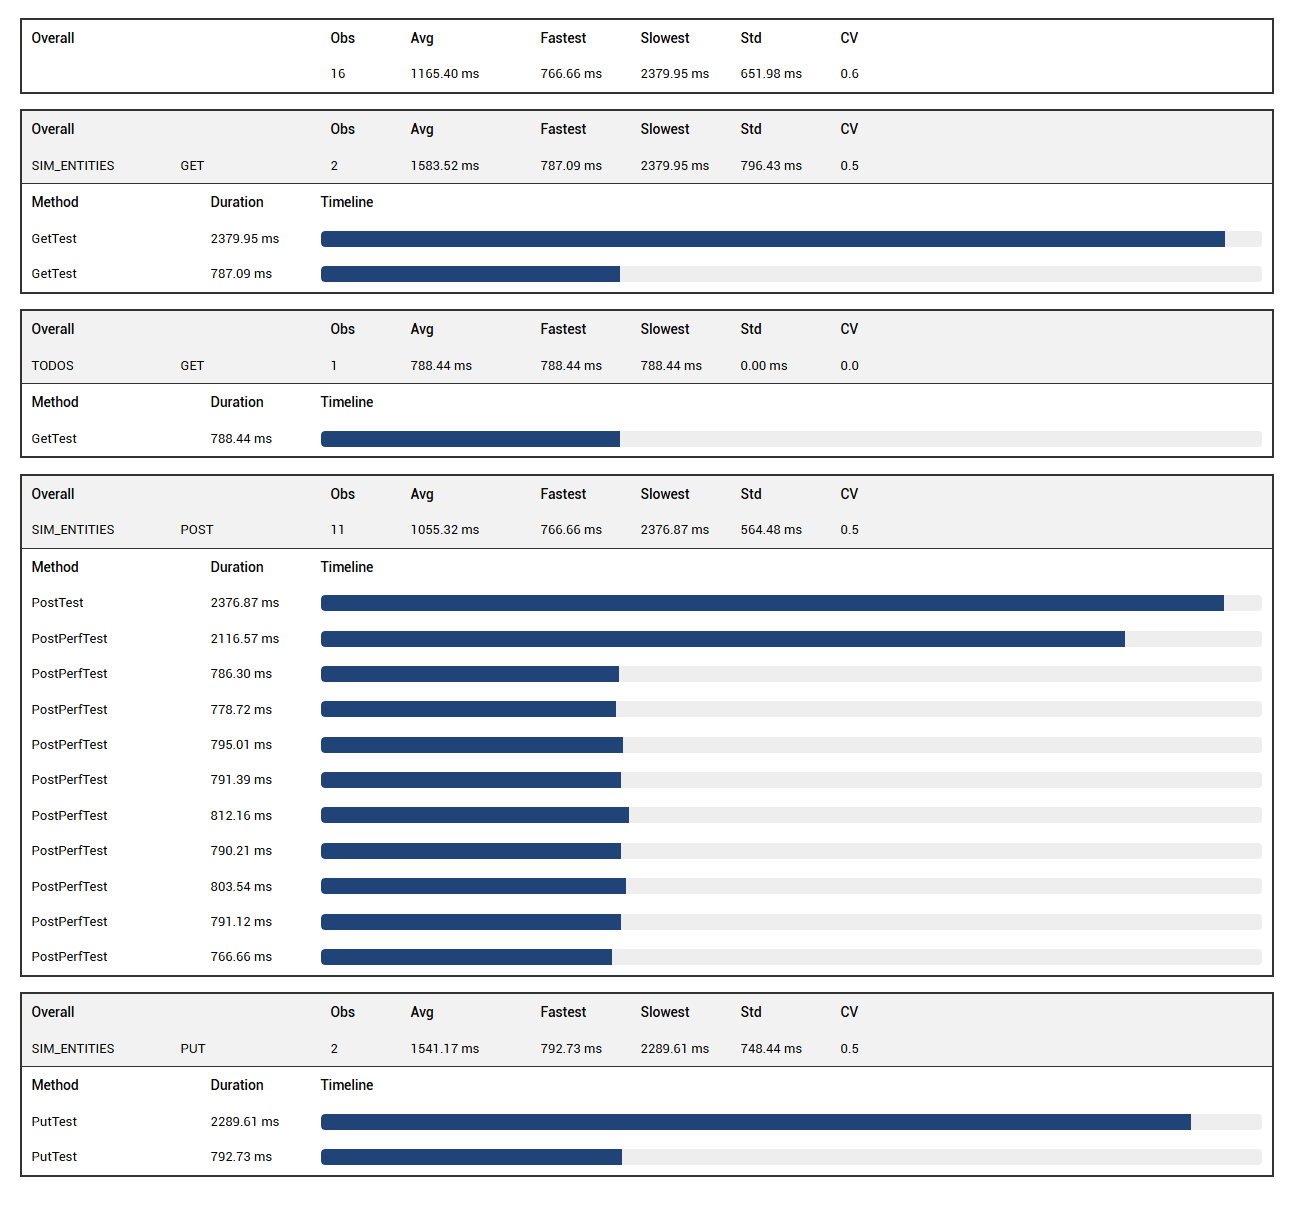
Performance Test Execution Report
If at least one rest.send request in the suite has trackPerformance = true, QED automatically generates a performance report. The performance summary appears at the bottom of the left-hand test list in Extent Reports, labelled "Performance Summary".
The report shows a top bar with the pooled average duration across all tracked requests, and a breakdown by endpoint and request type.
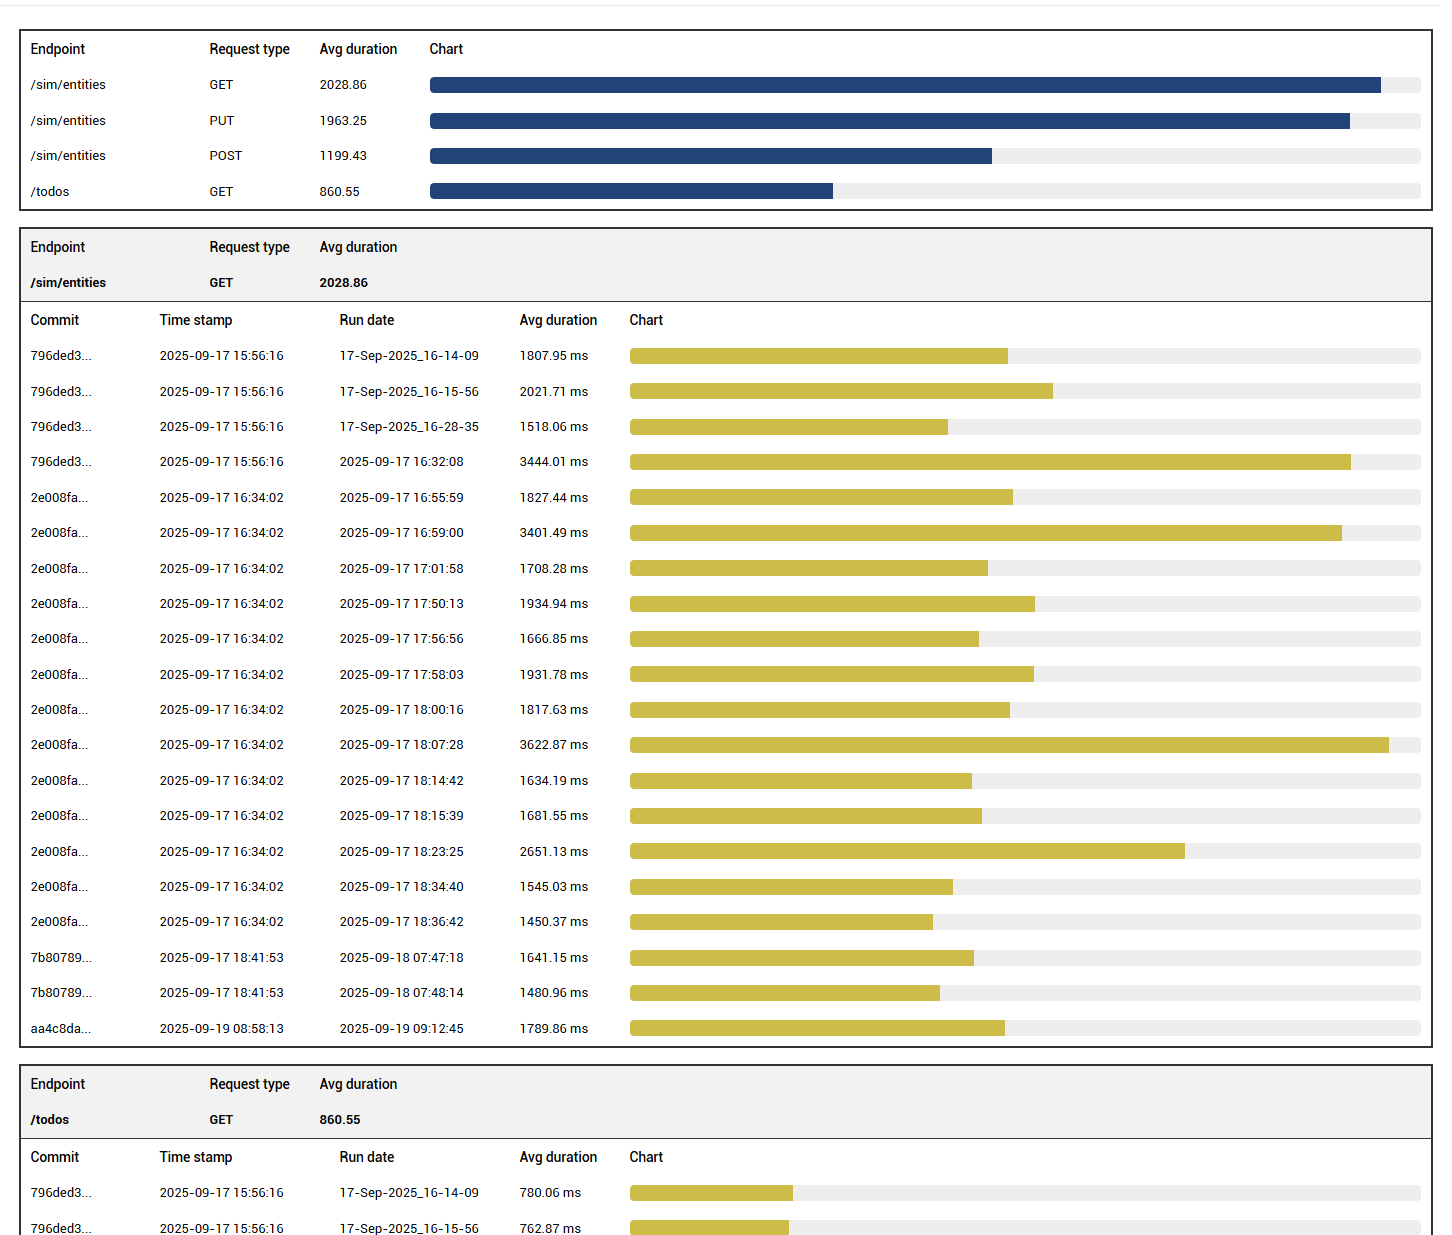
Performance History Report
You can configure how long run history is retained in terms of commits and runs per commit. Add the following to your project's config file:
"testrunmetadata": {
    "repository": "C:\\Projects\\qed",
    "sut": "apichallenges",
    "maxRunsPerCommit": 5,
    "maxCommitsToKeep": 20
}
repository— path to the repo, used to retrieve the latest commit numbersut— name of the system under test, used as the subdirectory name under<QED>/perf-history/where JSON history files are stored (e.g.<QED>/perf-history/apichallenges)
History retention is based on commit lineage and capped by maxRunsPerCommit and maxCommitsToKeep, ensuring meaningful trend analysis without bloating the report directory.
The history chart shows the variation in average response time per test run for each endpoint and request type.